Basic Usage
If you already have a project file that you would like to open, ViRelAy can be started on the command-line using the following command. If you do not have a project file yet, you can read the Example Project article, which guides you through the creation of a randomly generated project that you can use to familiarize yourself with the ViRelAy user interface. Creating a real-world project is much more involved, but if you would like to skip ahead, please refer to the How to Create a Real-World Project article, which describes the project creation process in-depth.
$ virelay '<project-file>' ['<project-file>' ...]
This command will start the server at http://localhost:8000 and automatically open your default browser. Optionally, you can specify an alternative host and port using the --host and --port command-line arguments.
Please note that starting ViRelAy using the provided command-line interface will start a rather slow development server. For improved load times or when running ViRelAy on a remote server, we recommend using the WSGI HTTP server Gunicorn. For more information, please refer to Using ViRelAy With Gunicorn.
After launching ViRelAy, you will be greeted with a user interface like in the following screenshot. The exact setup will depend on the project(s) that you have loaded, but in this instance the randomly generated test project is shown:
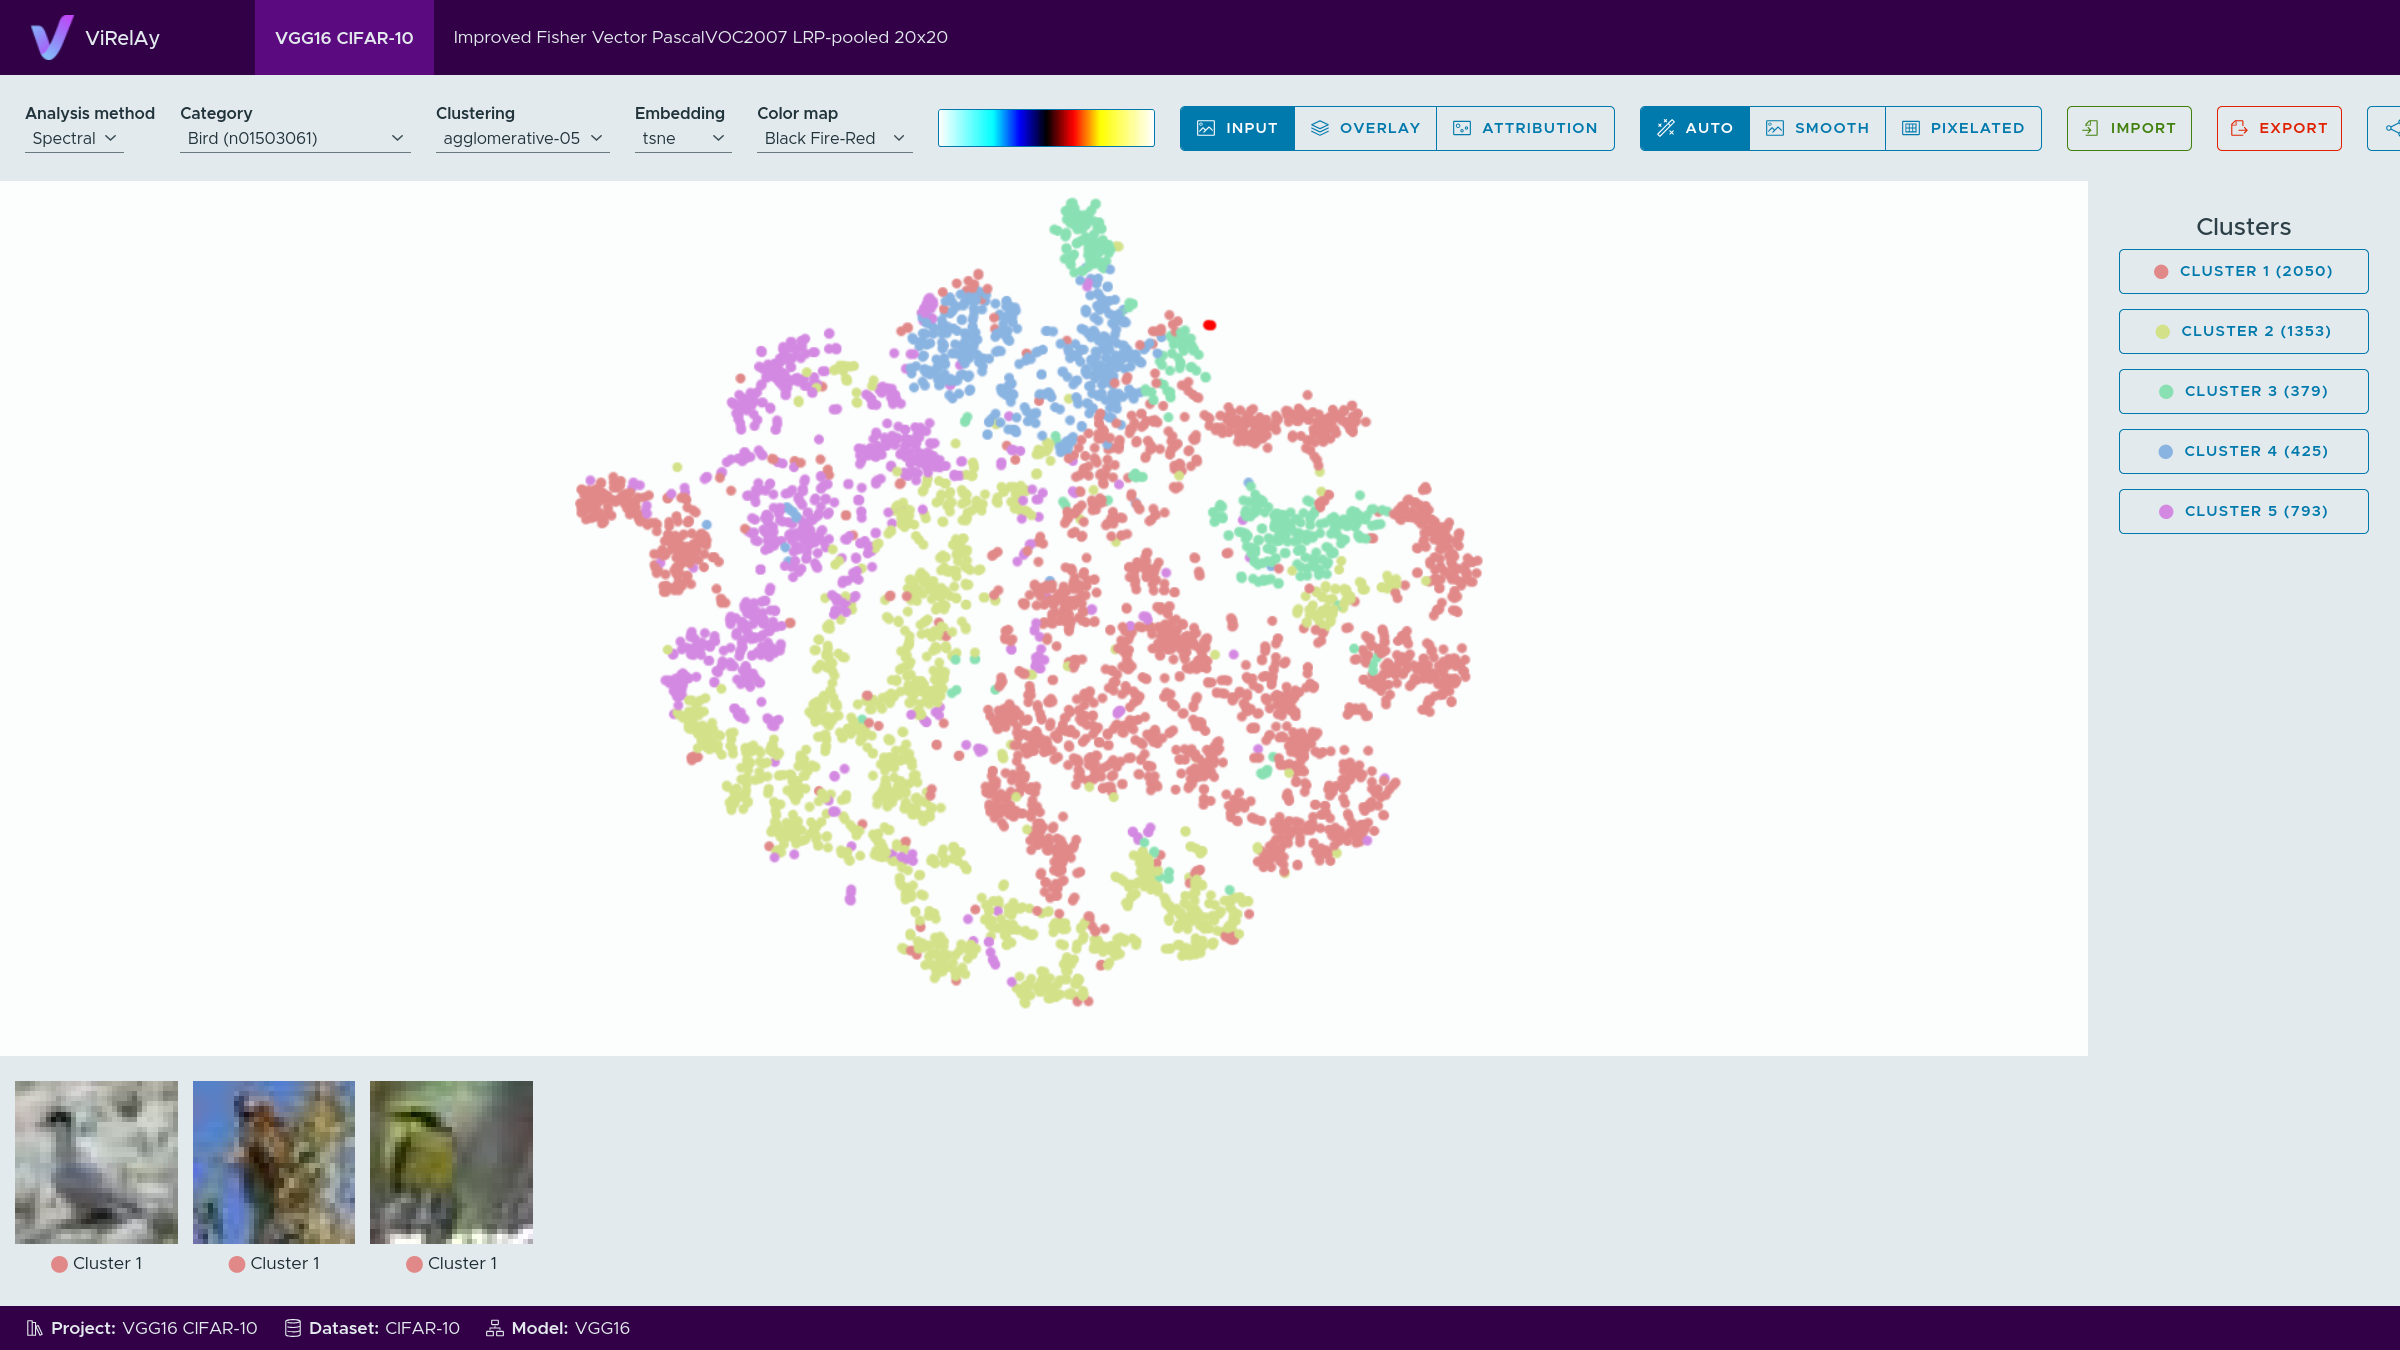
Figure 1: The user interface of ViRelAy.
At the very top of the ViRelAy UI, all loaded projects are displayed in tabs. Clicking a project tab will switch to the selected project. Figure 2 shows what the project selection looks like, when multiple projects are loaded.

Figure 2: The project selection in the ViRelAy UI, where all loaded projects are displayed as tabs.
At the very bottom of the ViRelAy UI, some basic information about the currently selected project is displayed: the name of the project, the name of the dataset, on which the model was trained, and the name of the classifier model itself. Figure 3 shows the project info pane for the test project.

Figure 3: The project info pane in the ViRelAy UI, which shows some basic information about the currently selected project.
In the center of the ViRelAy UI, the embedding viewer is situated. The embedding viewer displays the embedding vectors of the currently selected embedding method for the samples of the currently selected sample category. The embedding vectors are visualized as a point cloud. Each analysis in a project can contain multiple embedding methods. The colors of the embedding vectors correspond to the cluster they belong to, according to the currently selected clustering method.
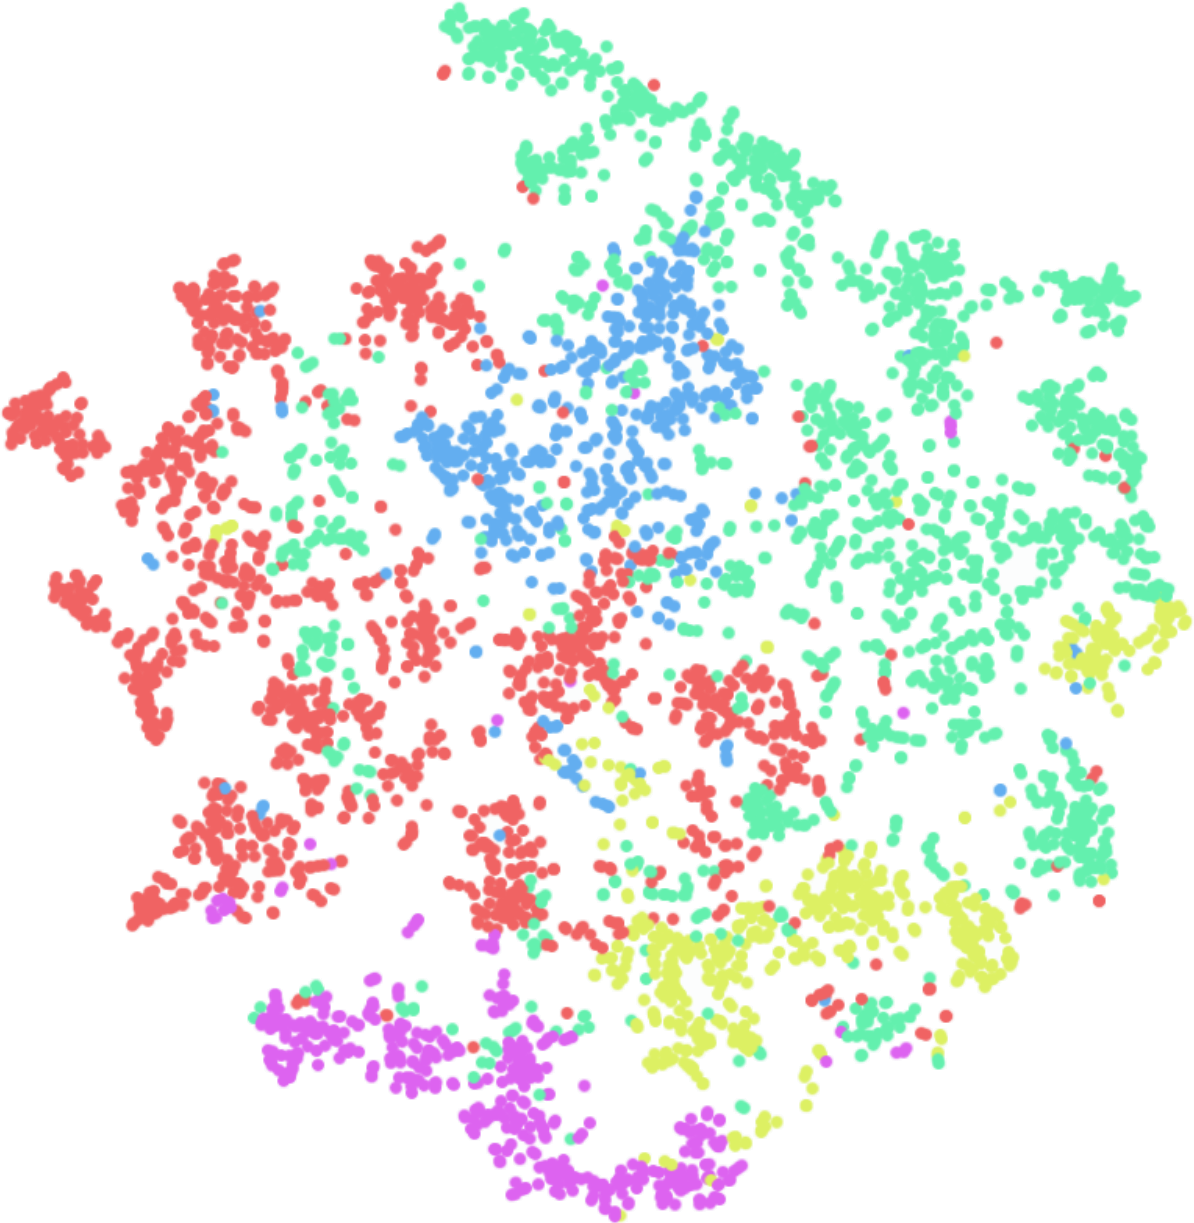
Figure 4: The embedding viewer in the ViRelAy UI, where the embedding vectors of the currently selected embedding method for the samples of the currently selected sample category are visualized.
The embedding viewer supports panning and zooming. To pan, click and hold the right mouse button and start moving the mouse pointer. Scrolling the mouse wheel will zoom into the region the mouse pointer is currently pointing at. Alternatively, click and hold the middle mouse button to zoom in by moving the mouse pointer up and zoom out by moving the mouse pointer down. When hovering the mouse pointer over an embedding vector, the dataset sample, which was the input to the classifier, is previewed at the top left of the embedding viewer. Embedding vectors can be selected by clicking and holding the left mouse button and moving the mouse pointer to draw a selection rectangle. Selected embedding vectors will have an increased saturation to distinguish them from the embedding vectors that are not selected.
When embedding vectors were selected, the sample viewer at the bottom of the ViRelAy UI shows the corresponding samples. Depending on the currently selected visualization mode, the sample viewer will display the dataset sample, which was the input to the classifier, the attribution of the classification, or an attribution superimposed onto the dataset sample. Attributions will be displayed as heatmaps using the currently selected color map. Both the visualization mode and the color map can be selected in the toolbox, which is situated right above the embedding viewer.
On the far right of the ViRelAy UI, the eigenvalues of the embedding, if available, as well as the clusters of the currently selected clustering method can be seen. The eigenvalue plot shows the eigenvalues of the eigendecomposition of the currently selected embedding method in ascending order. Below the eigenvalue plot, a list of all clusters of the current clustering method are displayed. These can be used to quickly select all embedding vectors of a cluster, by clicking the corresponding button. The cluster buttons are color-coded to match the colors of the embedding vectors in the embedding viewer and the number of embedding vectors in the cluster are displayed in parentheses.
Finally, at the top of the ViRelAy UI, below the project selection, the toolbox can be found. The toolbox allows the user to navigate the data of the current project. The toolbox can be seen in Figure 5.
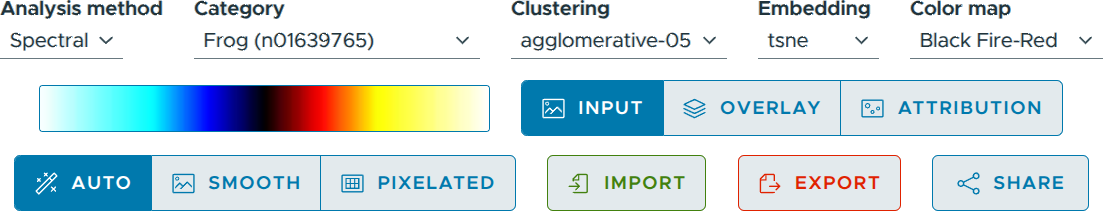
Figure 5: On the top of the ViRelAy UI the toolbox is displayed, where the user can select the analysis method, sample category, clustering method, embedding method, and the color map among other things. The image of the toolbar was broken up and stacked vertically to improve legibility.
For a detailed explanation of all features of ViRelAy, please refer to the Features article.