ViRelAy Documentation
Welcome to the documentation of ViRelAy, an XAI visualization tool for the analysis of the results of spectral relevance analysis (SpRAy) pipelines, as generated by CoRelAy . It runs a small web application to view, explore, and interact with the source data, its attributions, clusterings, and embeddings. ViRelAy is designed to simplify the analysis of classifiers and their underlying datasets. Findings can be imported, exported, and shared with others for easy collaboration. Currently, only image data is supported and attributions are expected to have the same shape as the corresponding input data.
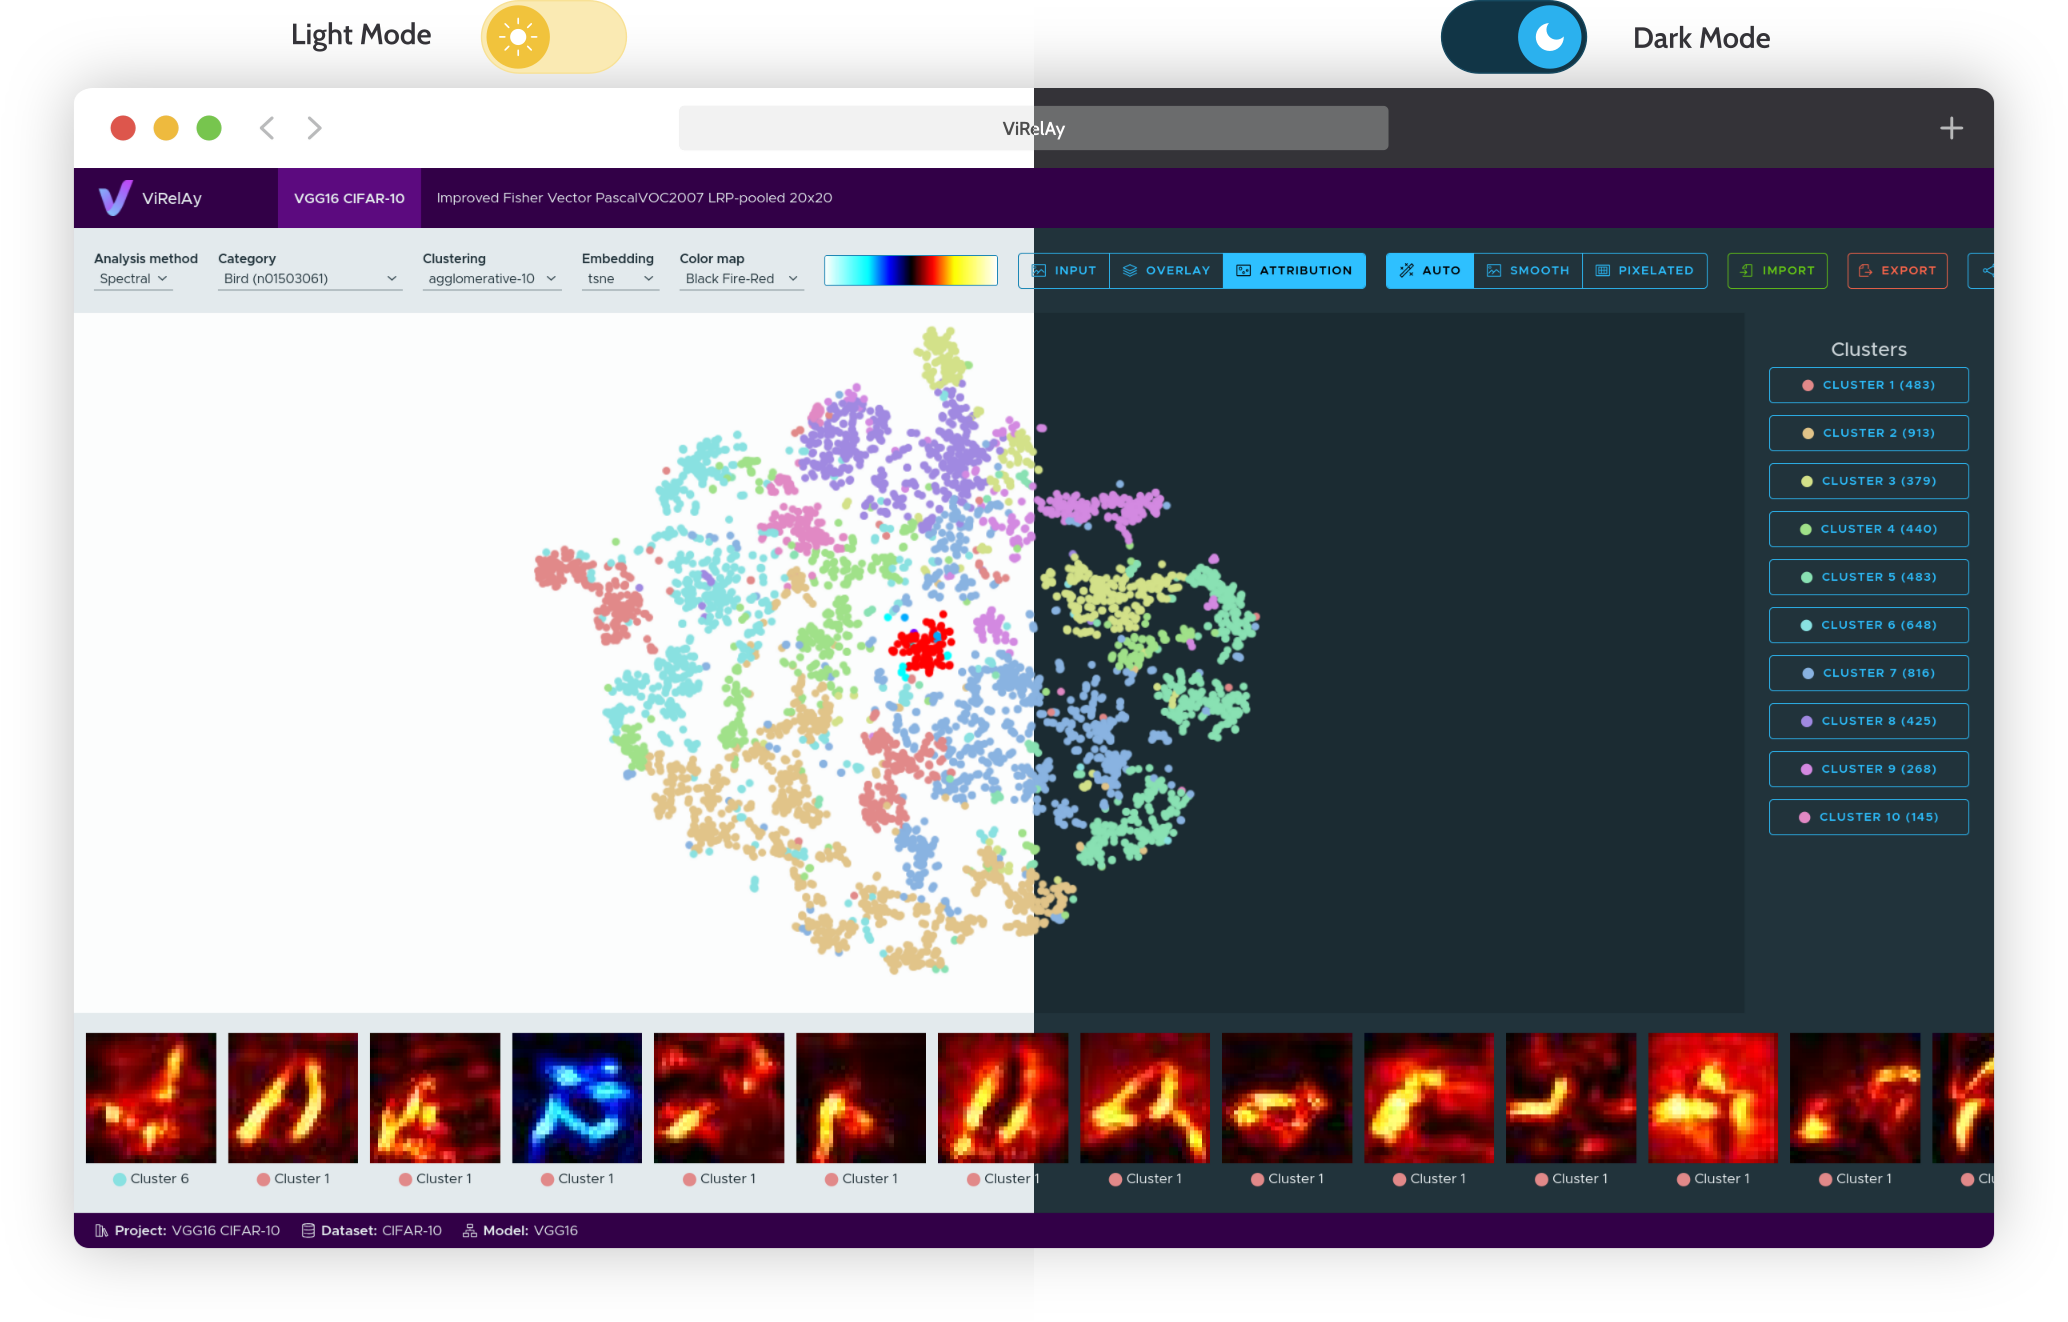
Figure 1: A screenshot of the ViRelAy user interface in both light and dark mode.
Contents
This documentation is organized into four main sections:
Getting Started – Basic instructions on how to install and use ViRelAy.
User Guide – In-depth information about all features of ViRelAy, including analysis techniques for classifiers and datasets, as well as usage examples.
Contributors Guide – An overview of the internal architecture of ViRelAy and guidelines for contributing to the project.
API Reference – Detailed descriptions of the modules, classes, methods, and functions included in the ViRelAy backend API. This part of the documentation is mainly aimed towards developers who want to contribute to the project.
Indices & Tables
Citing
We encourage you to cite our related paper [Anders et al., 2021] if ViRelAy has been useful for your research. To make it easier, we’ve included the relevant citation information below.
@article{anders2021software,
  author  = {Anders, Christopher J. and
             Neumann, David and
             Samek, Wojciech and
             Müller, Klaus-Robert and
             Lapuschkin, Sebastian},
  title   = {Software for Dataset-wide XAI: From Local Explanations to Global Insights with {Zennit}, {CoRelAy}, and {ViRelAy}},
  journal = {CoRR},
  volume  = {abs/2106.13200},
  year    = {2021},
}